
|
You can Win when you Follow the Cheese! We monitor the big market players and figure out which way they're betting. Our idea is to follow them, as they seem to know the turning points. |
| Home Tutorial Login Subscribe Learn more... |
| Cheese Tutorial |
|
You already know that when Cheese Factor is green, the traders are buying bullish instruments and when Cheese Factor is red, they are buying bearish instruments. So, buy green, sell red -- right? The problem is with timing. For example, during bull markets it can take a long time to form a top. During that time, the Cheese Factor will stay red, while traders get increasingly more bearish in anticipation of a top. How can we time it, so we don't commit too soon? To better identify turning points, we have devised a secondary indicator called Cheese Forecast (the yellow line). It smooths out the green/red bars and inverts the shape to match the market. The idea is to have something that will correlate with the market in terms of direction. So, when the yellow line turns up, the market should turn up and vice versa. How to use the Cheese Forecast When following the Cheese Forecast (the yellow line), we are basically looking for reversals. Each reversal on the yellow line should be followed with a reversal on S&P. That's the theory, anyways. Obviously, it won't be a 100% match. We are basing our indicator on a group of traders, and they can be off. But most of the time, they are pretty darn close. Here are some examples of reversals:
STEP ONE: Choose your time frame It is up to you to select an appropriate time frame which best suits your habits and risk tolerance. On a smaller scale, the Cheese Forecast (the yellow line) will reverse more often. This would mean more trades, perhaps more stopped out ones too. On a larger scale, the reversals are fewer, but you may miss the exact point of turnaround.
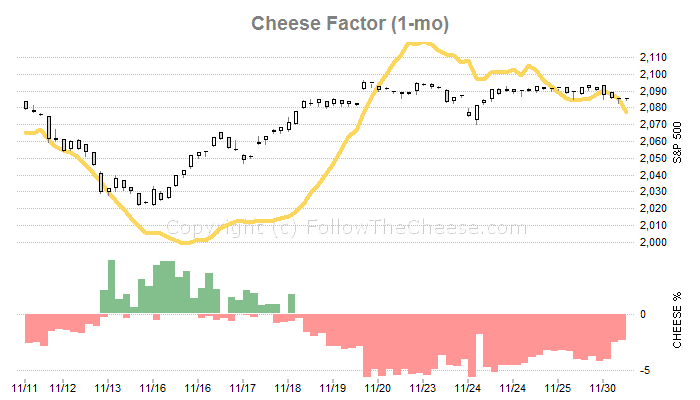
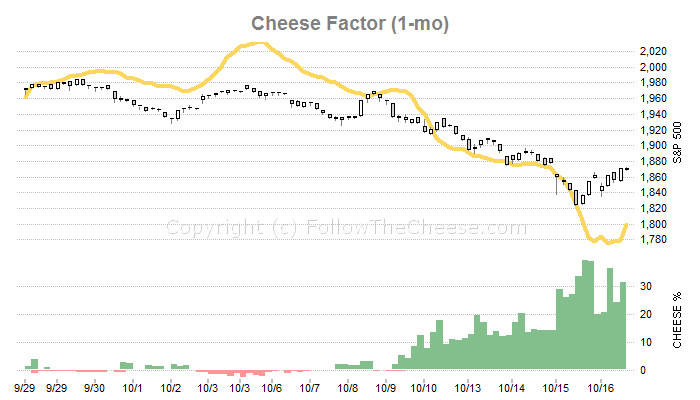
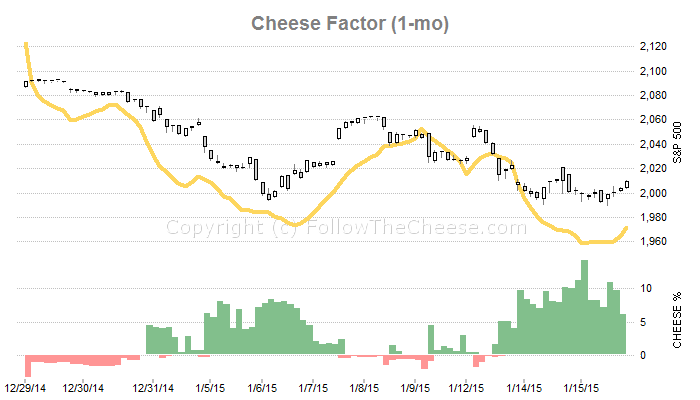
1-month
We recommend to follow this time frame only if you are a day-trader.
It is just too volatile for average swing-trader or investor, sometimes even reversing more than once intraday.
Also the Cheese Factor itself is not always accurate at that level, meaning the traders we are following
probably aren't trying to time the market to such precision. But it can be very helpful, especially to time your exits.
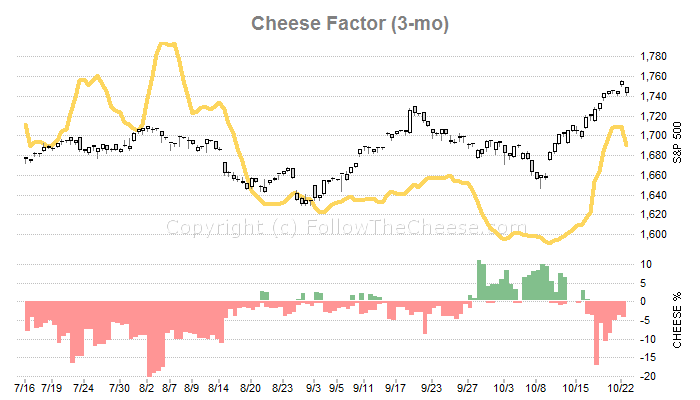
2-month
This is an excellent time frame for swing-trading, and especially for closing trades.
For opening trades, it can still be a bit too volatile, meaning some back-and-forth action will make you open/close positions
unnecessarily.
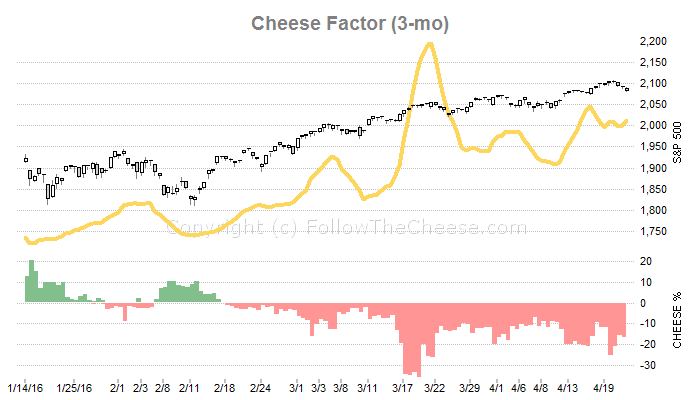
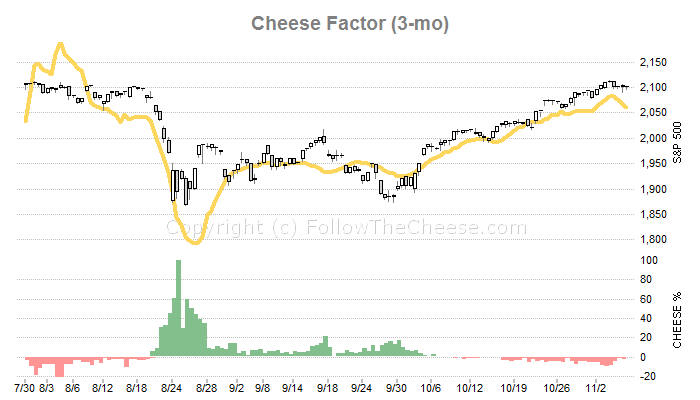
3-month
This time frame is our overall favorite for swing trading, and especially for opening trades.
Sometimes it may be a good idea to open your trade based on one time frame, and close it based on another. For example open based on 3-month Cheese Forecast, and close based on 2-month. The reason behind this strategy might be that once you have a profit, you want to protect as much of it as possible and a 2-month chart will be quicker to register a turn. STEP TWO: Buy when the Cheese Forecast turns up In this context, buy means buy the market and/or cover your bearish position. The Cheese Forecast will start turning up at the bottom of S&P run (leg). This assumes you are working with your chosen time frame. How much should the yellow line turn before we consider it a buy? You should observe a clear change of trend on the yellow line before committing. Here are some examples of buying:
It should be clear that all your usual rules about how to manage your positions should apply. We are not trying to teach you how to do that. STEP THREE: Sell when the Cheese Forecast turns down Again, sell means sell (short) the market and/or close your long positions. The Cheese Forecast will start turning down at the top of a S&P run (within your chosen time frame). The amount by which the yellow line reverses trend is again important. You should not act on every twitch of the line -- you must ovserve a clear trend change. Here are some examples of selling:
|
|
Copyright (c) 2007 and beyond, FollowTheCheese.com Timing technology provided by OptionMeter US Copyright restrictions apply. No part of this site may be reproduced without permission. Contact us at: support@followthecheese.com |
|
The content published on this site is for your information only. No warranty is given as to the accuracy or timeliness of the information. We do not issue buy/sell recommendations and we do not guarantee profitability of any particular investment. If you trade, you must bear responsibility for your own actions, and accept the possibility of loss. Past performance is no guarantee of future results. |